Two numbers that refused to behave the same way
Pathfinder is the perception model behind Hindsight. Its job is segmentation: it looks at a photo and labels every single pixel by what it is. This patch is sidewalk, this is a door, that is a staircase. It is the piece of vision our navigation app runs on, so getting it right matters to someone crossing a street.
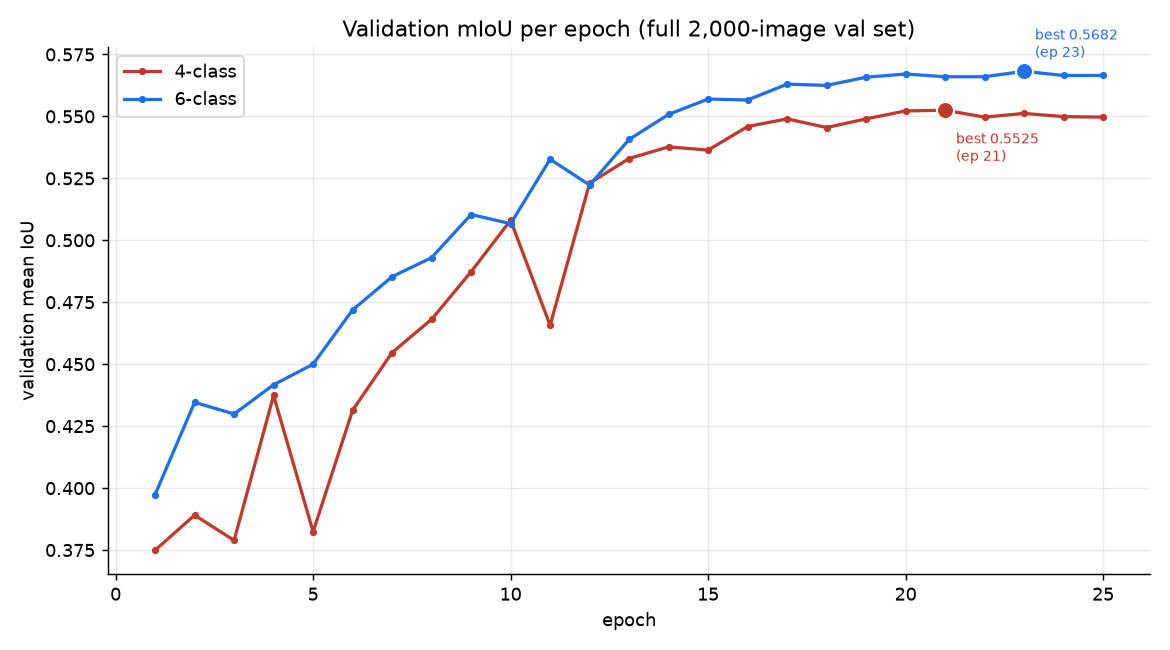
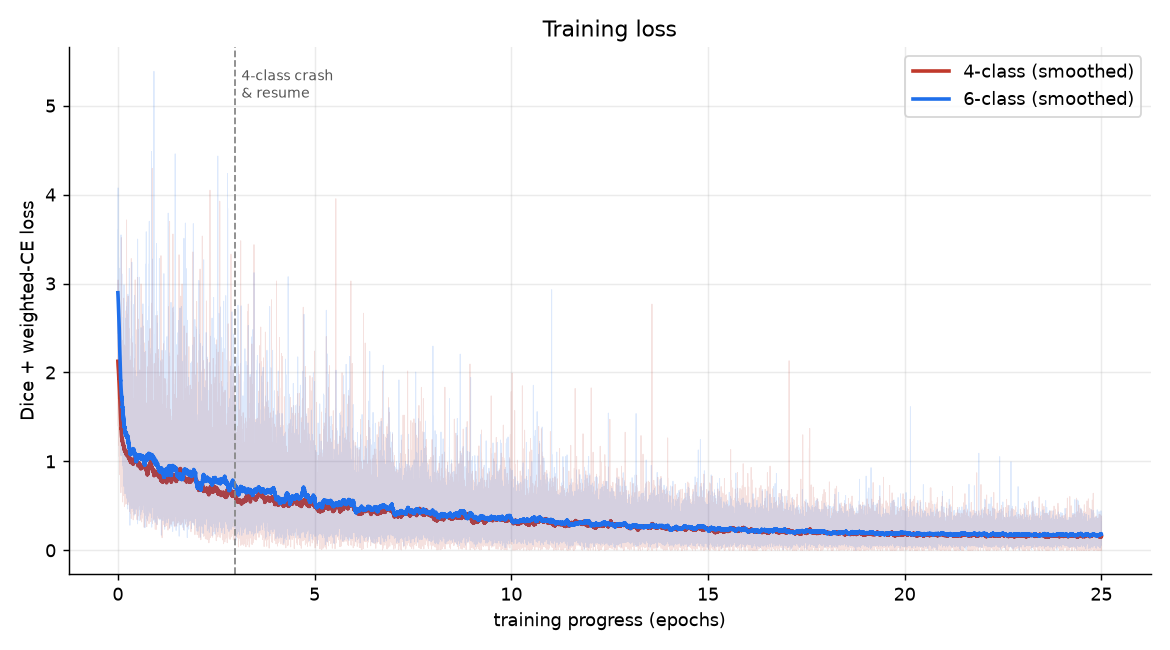
While it trained, two numbers scrolled past that would not agree with each other. The training loss, the model's private error score on the practice images, slid down smoothly and never really jumped back up. The validation score, how well the model does on 2,000 images it has never seen, climbed too, but it bounced around a lot on the way up, and then, toward the end, it quietly stopped bouncing and settled into a flat line.
So, two questions. Why was the honest test score so jumpy when the internal error was so smooth? And why did the jumpiness fade out on its own near the end, almost like the model was calming down? It felt like one thing going on rather than two, and it turns out there is. It comes down to a single dial.
Why the test score is bumpier than the loss
Three reasons stack up. First, it is measured on different images: a model in the middle of training is a moving target, and a moving target lands differently on a fresh test every time you check. Second, the metric moves in chunks: each pixel commits to a hard yes-or-no call, so a pixel that shifts from 49 percent sure it is a door to 51 percent barely moves the loss but flips a whole pixel into the correct column. Third, big steps overshoot: when the learning rate is high, every update yanks the model a real distance, so where it lands when you measure it swings around. The third reason is the one that connects to the second puzzle.
The learning rate is the dial, and we did not leave it fixed
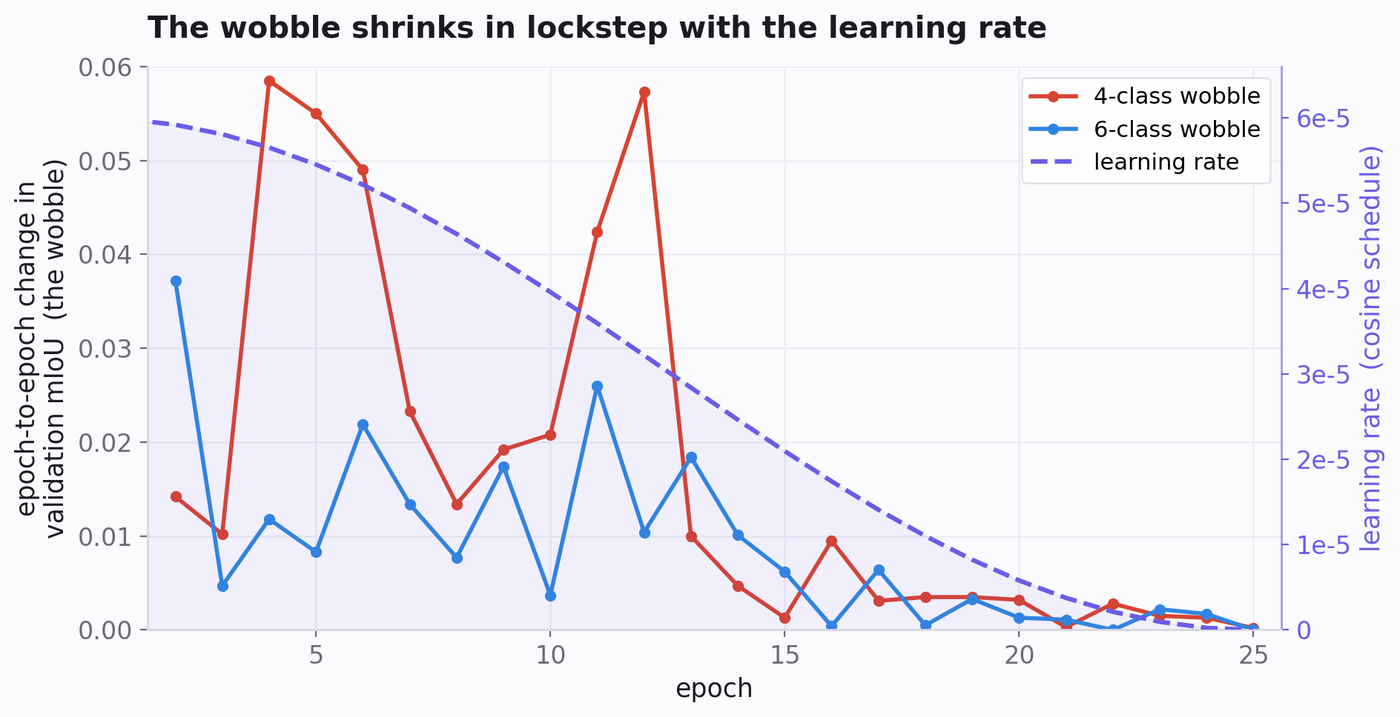
Both questions have the same answer, and it starts with the fact that the learning rate was never a constant. We used a cosine schedule: it starts tiny for a short warm-up, rises to the full rate of 6e-5, then follows the smooth downhill shape of a cosine curve to essentially zero by the final epoch. The steps start big and get gentler as training goes on.
Training is a ball rolling around a landscape, hunting for a low basin, and the learning rate is how hard you shove it on each step. Early on, with big shoves, the ball careens around. That is how it finds the right general region so fast, though it also means its exact resting spot jumps every time you look. That is the wobble in Figure 1. As the dial comes down the shoves get gentle, the ball rolls to the bottom and stays there, and the test score settles into that flat line.
There is a bonus buried in this. Gentle steps at the end tend to settle the ball into a broad, flat basin rather than a narrow crack, and the leading intuition among researchers, a well-supported picture rather than an ironclad law, is that broad basins generalize better. So annealing the learning rate calms the wobble and parks the model somewhere robust at the same time.
Does the data actually agree, or is this just a nice story?
A clean explanation is worth nothing if the numbers do not back it, so we plotted the one thing that would settle it. For every epoch we measured the size of the jump in the validation score from the epoch before, call it the wobble, and laid it over the learning rate curve. If the learning rate really drives the wobble, the two should fall together. They do, almost embarrassingly cleanly.
| Run | Avg jump, ep 2 to 8 rate high | Avg jump, ep 19 to 25 rate near zero | Shrink |
|---|---|---|---|
| 4-class | 0.0319 | 0.0018 | ~18x |
| 6-class | 0.0150 | 0.0014 | ~11x |
The effect is large enough that you do not have to squint. The average jump shrank about eighteenfold in the 4-class run and elevenfold in the 6-class one, over the exact span where the learning rate was annealed toward zero, and across the whole run the jump size tracks the learning rate at +0.67 and +0.66. Correlation by itself would settle very little here. What makes it convincing is that the mechanism predicts exactly this sign and this shape, and the run delivers both.
What the model is actually good and bad at
| Class | Final IoU |
|---|---|
| Background | 0.941 |
| Road | 0.738 |
| Floor | 0.661 |
| Sidewalk | 0.494 |
| Stairs | 0.304 |
| Door | 0.262 |
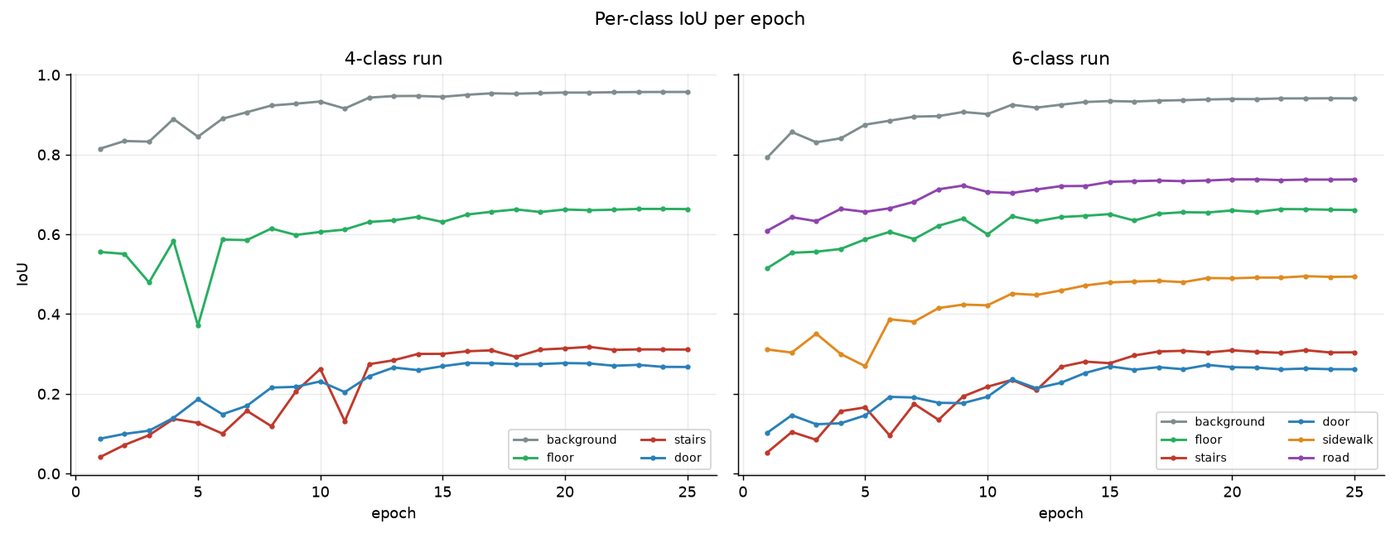
Background, floor, and road are the strong suits. Stairs is the stubborn one, topping out near 0.31, which honestly makes sense: stairs are a visual mess, changing completely with lighting, angle, and railings, and the thing that defines them, a step edge, is a thin feature that is easy to miss. Doors sit low for a similar reason.
The result we most wanted to see is the safety-relevant one. Road sits about 0.24 IoU above sidewalk and stays there for the whole run, so the model is not blurring "the path you walk on" into "the thing cars drive on." For a navigation aid, that is precisely the distinction that has to hold.
The run was messier than two clean lines
The 4-class run did not go smoothly. It crashed at epoch 3, a thermal fault on the training machine's GPU, and was resumed from the last good checkpoint at a smaller batch size, which is why its step count no longer lines up with the 6-class run. So the loss chart plots progress in epochs rather than raw steps and marks the resume point. Airbrushing that seam out would have made for a prettier chart, and we would rather have the honest one.
Going from 4 classes to 6 raised the headline score from 0.5525 to 0.5682, which reads at first like the model getting sharper. We looked at it more carefully than that. The score averages over whichever classes are in play, and road is one of the easier ones, so adding it lifts the average on its own. On the four classes both versions share, the 6-class model actually sits slightly lower. The finer split gave the model a cleaner set of labels to learn, and we would not claim more than that.
What the jumpy accuracy was actually telling us
The jumpiness had been reporting on step size the whole time. A model taking big exploratory steps lands somewhere different every time you measure it, and the cosine learning rate is what walks that exploration down into a settled, stable model. You can watch the handoff happen in Figure 3, where the wobble and the learning rate come down together, in lockstep.
That has practical weight for Hindsight. When the model is guiding a blind user across a street, stability matters as much as the score does. We need behavior that holds steady when a scene changes in tiny, meaningless ways, and a model sitting in a wide basin behaves like that. The flat, boring-looking plateau at the tail of Figure 1 is the part of that chart we find most reassuring.
The part we did not expect was how much this changes how we read every training curve now. Once you see the wobble as the learning rate's fingerprint, you cannot unsee it, and a jagged accuracy line stops looking like a problem and starts looking like a readout of exactly where in the valley the model currently is.